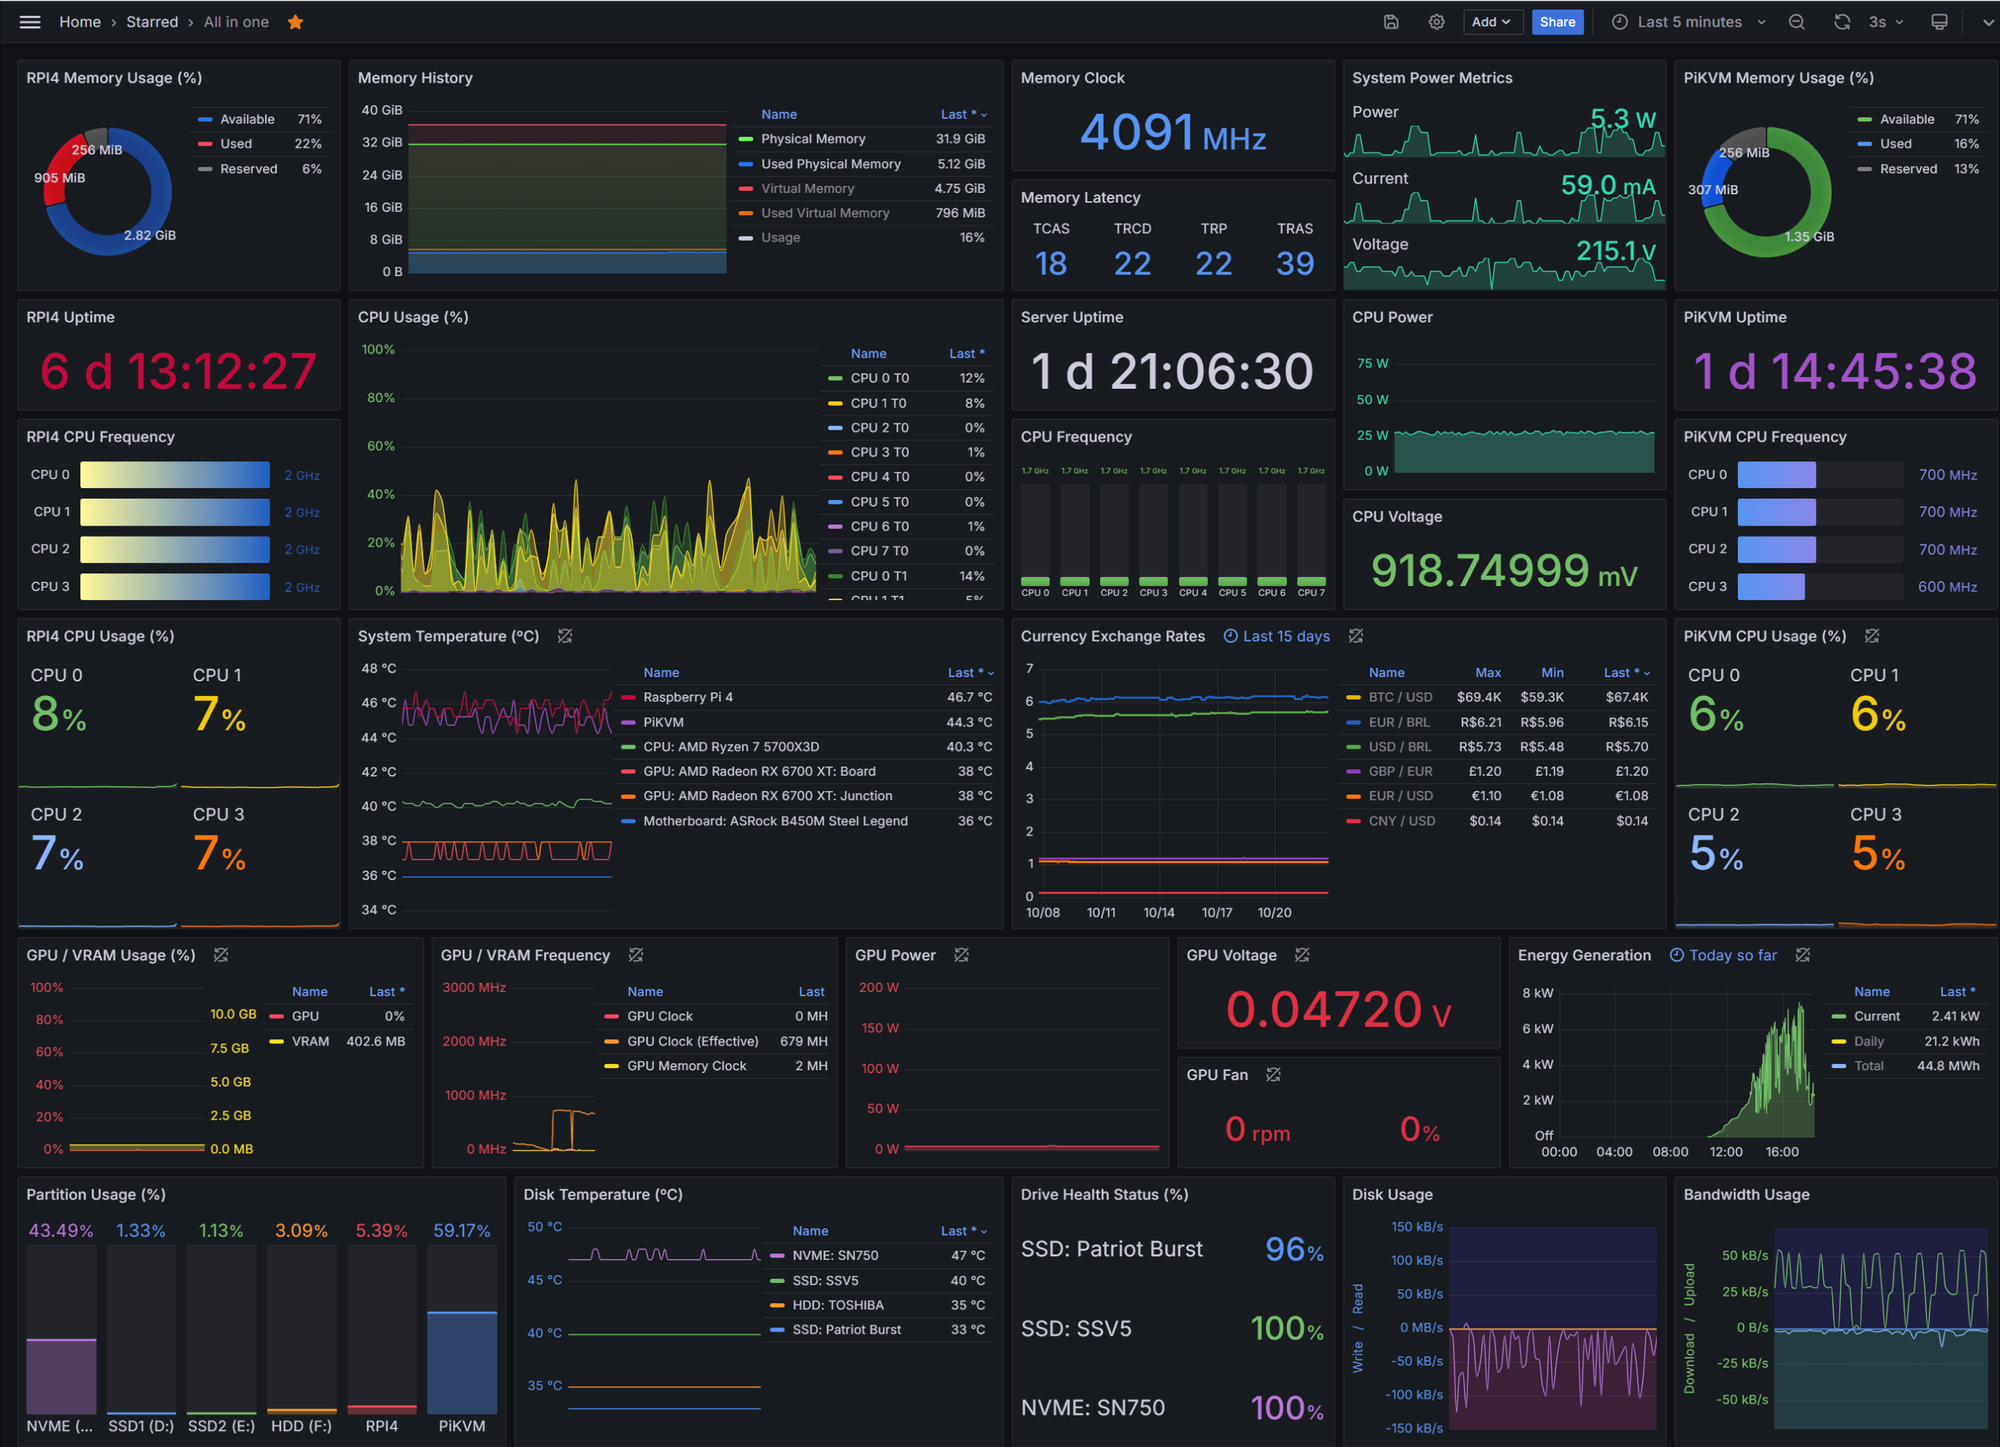
Design and Implementation of a Monitoring Solution for a Collection of Spring Boot Applications on OpenShift
- Title: Design and Implementation of a Monitoring Solution for a Collection of Spring Boot Applications on OpenShift
- Short Description: The project aimed to develop a robust and scalable monitoring solution for multiple Spring Boot applications running in an OpenShift environment. The solution leverages state-of-the-art monitoring tools to provide real-time insights, performance metrics, and alerting.
- Technologies: Grafana, Prometheus, Thanos, Spring Boot Actuator, OpenShift
1. The Challenge
- Problem Statement: Monitoring a distributed system of Spring Boot applications in an OpenShift cluster posed challenges such as decentralized metrics collection, lack of visibility into application health, and limited alerting capabilities. The goal was to design a unified solution to collect, store, and visualize metrics across all applications, with high availability and scalability.
2. Solution & Implementation
- Technical Approach:
- Spring Boot Actuator was used to expose application metrics, which were scraped by Prometheus, a powerful monitoring system.
- Prometheus collected and stored the metrics in a time-series database, providing robust querying capabilities.
- Thanos was integrated to extend Prometheus’ functionality with long-term storage, high availability, and cross-cluster federation of metrics.
- Grafana was used as the visualization and dashboarding tool, enabling interactive and customizable dashboards for real-time monitoring and analysis.
- The monitoring stack was deployed in the OpenShift environment, ensuring seamless integration with the cluster and its resources.
- Methods:
- Microservices Monitoring: Each Spring Boot application exposed metrics via Actuator endpoints, allowing granular visibility into application-specific KPIs.
- Real-time Alerts: Prometheus Alertmanager was configured to notify the team of threshold breaches or critical issues via email and chat integrations.
- Dashboards: Grafana dashboards were customized for various stakeholders, providing insights tailored to developers, operations, and management.
3. Results & Learnings
- Results:
- A centralized monitoring solution providing comprehensive visibility into the performance and health of all Spring Boot applications.
- Improved incident response times through real-time alerts and actionable insights.
- Enhanced scalability and durability with Thanos for long-term metrics retention and redundancy.
- Key Learnings:
- The integration of Thanos significantly improved the scalability and reliability of the monitoring stack, making it suitable for enterprise-scale applications.
- Early configuration of Spring Boot Actuator endpoints across applications was essential for consistent and accurate metrics collection.
- Grafana’s flexibility allowed for the creation of user-specific dashboards, ensuring all stakeholders had relevant and actionable insights.
4. Outlook
- Follow-up Projects:
- Further refinement of alerting thresholds and advanced query development for deeper insights into system behavior.
- Exploration of machine learning techniques to analyze historical metrics and predict potential system failures.
- Expansion of the monitoring solution to include additional tools, such as distributed tracing, to provide a complete observability framework.




Comments